Javascript debugging in Visual Studio
I couldn't get the javascript debugging on VS2008 for the longest time. I've gotten away all this time by using Firebug, a great web development tool on firefox. It includes a debugger and profiler for javascript.
But, I've seen it done in VS2008 before. It just it bloody never worked for me, and I finally got it working. Here is the gotcha that doesn't seem to be documented anywhere.
- Visual Studio javascript debugger only works for Internet Explorer
seems obvious, but I made the mistake of hoping that it work for other browsers too. - Internet Explorer HAS TO BE SET as your default browser!
Visual studio needs to be the one to launch the IE instance. So the easiest way to do this is to make IE the default browser. This is the gotcha. And no one seem to mentioned it in any blog. So here it is! spread the words out.(You would've thought that attaching a debugger manually to IExplore.exe will do the same thing, but it doesn't seem to work for me all this time ... need to reconfirm it again at some point)
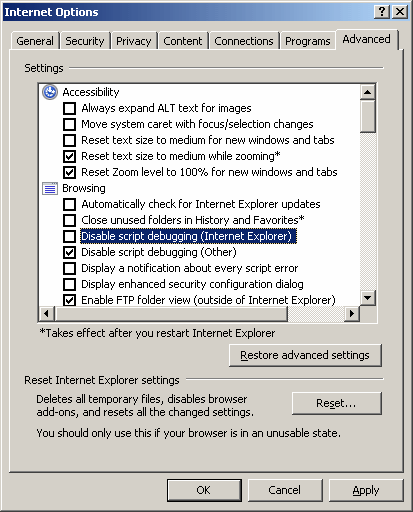
- Enable javascript debugging on IE
Tools > Internet Options > Advanced
and it should look like this:

* notice that I have 'Disable script debugging (Internet Explorer)' unticked. - 'Script Documents' and you're set!
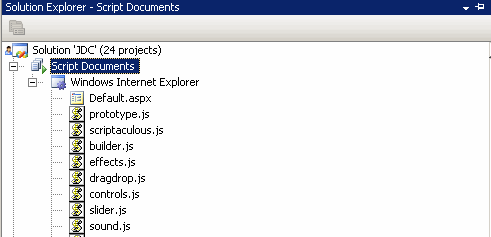
Run the web project by pressing F5 on Visual Studio and notice in the solution explorer and you'd get 'Script Documents' node.This is the sign that you've successfuly detached the javascript debugger to the Internet Explorer instance.

Start applying breakpoints on the javascript itself, and you're all set!
This is tested on Visual Studio 2008 SP1 and IE 7.0